GSoC Coding Phase - Part 1
Hello everyone!
A lot has happened since the GSoC results were declared! I’ve got quite a few things implemented in my project, I’ll be breaking the discussion of the first part of the coding phase into two or three parts. So lets get into it without further ado.
According to my proposal here, I had one week of community bonding, during which I had to make sure that I had everything I needed to begin with the project, and discuss with the mentors what i should be doing ahead of time. I received a mail from my mentors, Brad and Marc welcoming me to the program. After some discussion it was decided that I should modify my milestones a little bit. Swift for TensorFlow is being used in the Fast.ai course. And there’s a lot of interest in displaying plots in Jupyter notebooks, which is being driven by this. This was to be moved to the first milestone. I have never worked with Jupyter notebooks before let alone editing code that communicated with a Jupyter Kernel. Marc guided me through this. It was decided that for an initial implementation I could use the Swift-Python interoperability to display base64 images in a relatively straightforward manner. Once I implemented some of the planned plots I could work on a pure Swift implementation.
One of the most important parts of building a framework is that it functions as expected. There will definitely be many revisions and changes to the code later on. This warranted a need for the presence of some tests included in the project repository. This would help in making sure that new changes did not break the previously working plots. (I am really glad that we decided to include this in the first milestone itself. It helped me find a really important bug! We’ll come to it in later on)
I have been a little vague in my proposal about implementation of Sub Plots. For those who don’t know what Sub Plots are, they are multiple graphs included in a single display/image. They can be of any type(Line Graph, Bar Graph, etc.). It was necessary to include Sub Plots in the first milestone itself because each Plot would have to be coded in a way that it could be part of a Sub Plot. Implementing all the plots independently and later adding Sub Plot support would be a lot of extra work!
So this is what was decided. In the first milestone I would do the following:
- Make a simple Line Chart implementation with Sub Plot support.
- Setup tests that saves images.
- Get a base64 encoded PNG and use it in Jupyter notebook. Later work on python free implementation.
- Complete line chart implementation in the leftover time.
The rest of the stuff for the first milestone according to my proposal were to be moved to the second milestone.
It didn’t take long for me to complete the simple line chart. I used most of the code from the prototype I had made with a few changes.
Let’s look briefly at the LineGraph implementation. All the further discussion will be applicable to Linux (I am using Ubuntu 18.04 LTS) unless otherwise specified.
The first step was to set up the Swift Package. For absolute beginners, this is how you initialise a Swift Package using the Swift Package manager:
Execute this command in the terminal.
swift package init --type library
This will initialise a package that is primarily meant to be a library. If you want a package with an executable as the build product, you can change the type flag to executable.
Before implementing the plots I had to set up the renderers because they were the entities that would handle all the image generation. The plan was to have almost no plotting logic in the Renderers. They would just allow you to draw primitives such as Lines, Rectangles, Text, etc.
One of the Renderers part of the project is the Anti-Grain Geometry C++ library, developed by the late Maxim Shemanarev. I wrote some code to render simple primitives necessary for a Line Graph. Although Swift Package Manager can compile C++ code, C++ functions aren’t directly accessible from Swift code. So I had to write a bridging C-headers. You can call the C-functions from Swift directly which in turn call the C++ functions. You can find the implementation here.
One other aim of implementing different rendering backends was to facilitate adding more backends in the future. This required all the Renderers to have some main stuff in common. So I made a Renderer protocol that included the main functions that every Renderer must have. Each Renderer will have to conform to that protocol.
The AGGRenderer worked fine apart from one thing. The plot dimensions and and therefore the buffer size were hard coded. This meant that the user couldn’t change the size of the image rendered. This was obviously a big handicap to the end user. But for the moment I decided to focus on implementing the plot and getting the basic structure up and running. I could deal with it later on.
The other Renderer I planned to implement was a simple SVGRenderer written in Swift. The implementation is pretty simple and straightforward just like the SVG format. It has a String variable that will describe the image. Whenever you need to draw a primitive you pass the data to the SVGRenderer and it concatenates the relevant tag to the String. In the end the Renderer saves the String into a .svg file.
We’re talking about passing the plotting data to the Renderer, but how does that happen? I have defined a Point type which is a struct. It contains two Floats, x and y. You can pass the plotting data to the Renderer in the form of Point variable, or Point arrays. But the end user need not worry about this. All this will be handled by the Plots. Which brings us to the LineGraph implementation.
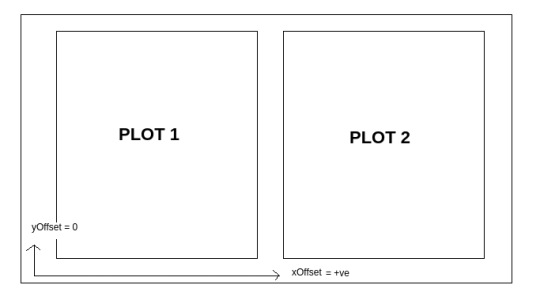
What I noticed first was that each plot would have to have the support of being a SubPlot. Therefore the renderer would need each image and plot to have separate dimensions in case of a SubPlot. Lets take an example of two SubPlots stacked horizontally. An easy way to go about it would be to do all the plot calculations of each plot in its own independent co-ordinate system and the shift the origin of each plot as required while drawing it.So what I did was create a Plot protocol with a PlotDimensions type that held the image size and the dimesions of the current plot being rendered, and two offset variables, xOffset and yOffset respectively. In this case the xOffset of the second SubPlot will be a positive number and the yOffset will be zero for both of them. The plot dimensions will be equal divisions of the net image space available to all the Sub Plots. The Renderer will just shift the origin of each SubPlot by (xOffset, yOffset). This did the job.
The Plot protocol has just one more method called drawGraph(). This was because each Plot had to have the functionality to just draw the plot in memory irrespective of what mode of output(like saving images in case of AGG, or displaying an image in a window in case an OpenGL implementation was written) the used Renderer would have. Also this facilitated drawing each SubPlot separately to the image before generating the final output.
Then I took the plotting logic from my prototype and the basic Line Graph was done.
The next step was to set up the tests. I created an examples directory with individual executable modules, each demonstrating a single feature. In this directory I made a Reference directory with two separate directories for AGG and SVG renders. So that anyone could run all the tests easily in one go, I made a simple bash script with the commands to run each example like so:
swift run <Executable Example Module Name>
Then came the time to let the users show the plots in a Jupyter Notebook. Initially the way I did this was, save the image as usual using the AGGRenderer, re read it from the disk encode it to base64 in C++ code, and send back the String to Swift code. But there was a better way that my mentors suggested. The library that I was using to encode PNGs, lodepng, allowed you to encode the image in memory and not save it to the disk. I could return a pointer to a buffer with the encoded bytes, to the Swift code and use some functions under Foundation to do the base64 encoding in Swift itself. This could come in handy sometime later if another Renderer could generate images that coudl be encoded to base64. I did the encoding using a function like this:
public func encodeBase64PNG(pngBufferPointer: UnsafePointer<UInt8>, bufferSize: Int) -> String {
let pngBuffer : NSData = NSData(bytes: pngBufferPointer, length: bufferSize)
return pngBuffer.base64EncodedString(options: .lineLength64Characters)
}
To display the image in Jupyter I added these lines to the EnableIPythonDisplay.swift file in the swift-jupyter repository:
func display(base64EncodedPNG: String) {
let displayImage = Python.import(“IPython.display”)
let codecs = Python.import(“codecs”)
let imageData = codecs.decode(Python.bytes(base64EncodedPNG, encoding: “utf8”), encoding: “base64”)
displayImage.Image(data: imageData, format: “png”).display()
}
To display the plot the only thing the user has to do is to include this file in their jupyter notebook, get the base64 image from the plot object and pass it to the display function.
This completed all the main stuff I had planned for my first milestone well before the deadline. By this time the official coding period hadn’t started yet. The first deadline was June 24 and I had almost a month left. I could cover a lot more stuff in my first milestone itself, so I decided to complete the Line Plot and keep at least the Bar Chart implementation in my first milestone.
You can find all the code here.
This post has already gotten pretty long, so I’ll sign off here. I’ll be discussing the rest of my Line Graph implementation, Bar Chart implementation and how setting up the tests beforehand helped me avoid a bug, all in my next post.
Stay tuned!
PS: Don’t forget to subscribe to the Swift for TensorFlow newsletter to stay up to date with the work being done and the happenings of the S4TF community!
Here’s the link: https://www.s4tfnews.com/
PPS: Also recently a Swift for TensorFlow Special Interest Group has been announced to help steer the framework. Weekly meetings will be held discussion the progress and plan ahead. Anyone interested can sign up to the mailing list here.
Enjoy Reading This Article?
Here are some more articles you might like to read next: